 Verisutras
AI and the Global Jobs Question: Six Waves of Disruption, and What Comes Next
Every wave of automation produces the same two arguments, repeated at global scale: technology has always created more jobs than it destroys, and this time feels different anyway.
Both arguments use real data. The full picture, across six global waves of change, is more specific than either one alone.
The Arc: Six Waves
Together, six overlapping waves, starting with the shift off the land itself, have each displaced the work of the one before it.
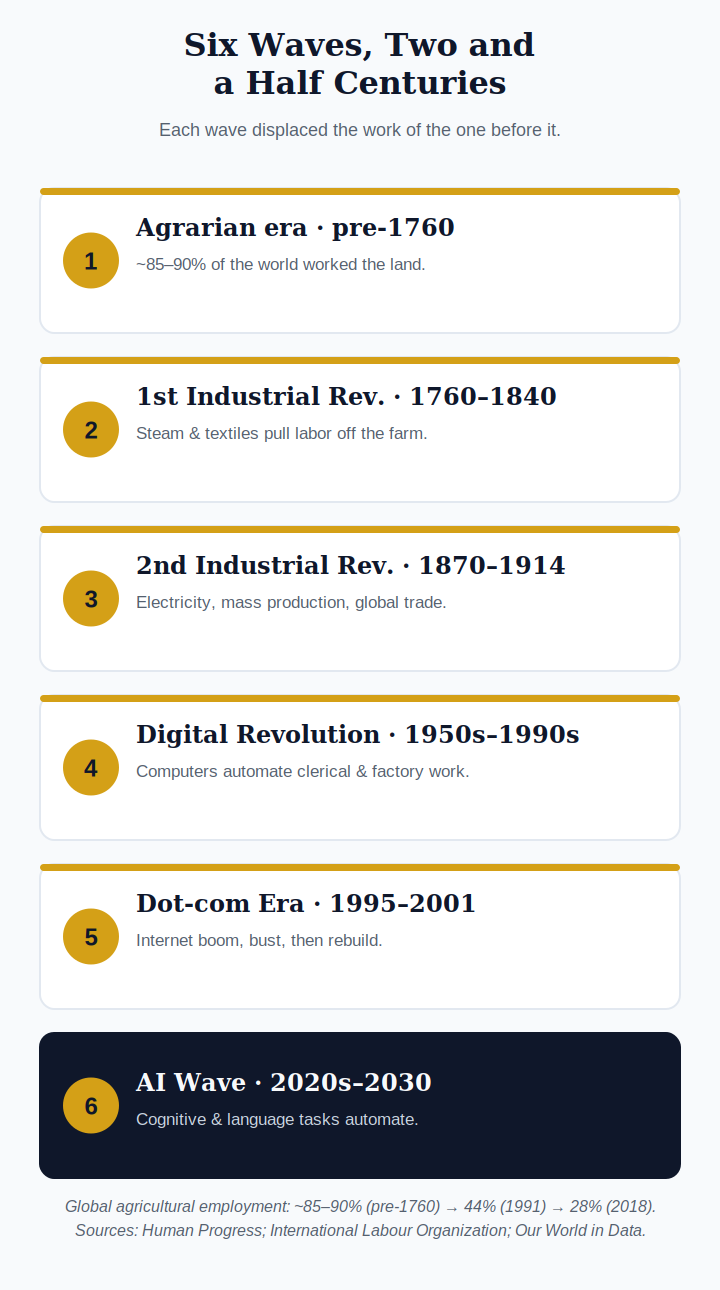
Global agricultural employment: ~85-90% (pre-1760) to 44% (1991) to 28% (2018).
Wave 1: The Agrarian Era (pre-1760)
Before mechanization, roughly 85 to 90% of the world’s population worked the land.
Wave 2: The First Industrial Revolution (1760-1840)
Steam power and mechanized textile production pulled workers off the land and into factories, first in Britain, then across Europe and North America.
Wave 3: The Second Industrial Revolution (1870-1914)
Electrification and mass production globalized manufacturing. By 1944, manufacturing alone employed 38% of the U.S. workforce at its peak, and comparable industrial employment booms occurred across Europe and, later, Japan.
Wave 4: The Digital Revolution (1950s-1990s)
Computers and word processors automated clerical and administrative work worldwide. In the United States alone, the specific occupation of typists and stenographers fell from 1.7 million workers in 1950 to roughly 37,200 by 2023, a decline of about 98%.
Total employment did not shrink alongside it. U.S. employment grew from about 61 million in 1953 to over 163 million today. The pattern held globally as computing spread: clerical work fell, and an entirely new layer of computer-literate, white-collar work replaced it.
Wave 5: The Dot-com Era (1995-2001)
The clearest recent rehearsal for an AI-style shock. The Nasdaq rose 600% between 1995 and 2000, then fell 78% from peak to trough. Silicon Valley alone lost roughly 200,000 tech jobs between 2001 and 2004.
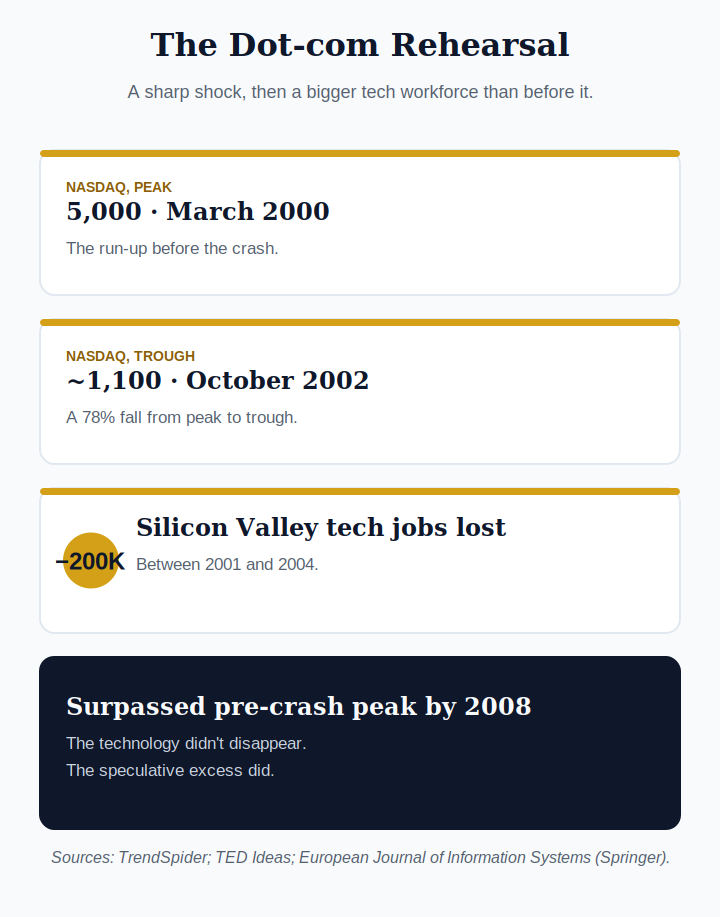
A sharp, painful correction, followed by a larger tech workforce than before it.
By 2008, U.S. high-tech employment had surpassed its pre-crash peak. The technology did not disappear after the crash; the speculative excess did.
Wave 6: The AI Wave (2020s-2030)
The current wave, and the one with an actual global forecast attached to it.
What the World Economic Forum Actually Projects
The WEF’s Future of Jobs Report 2025 surveyed over 1,000 employers across 55 economies and 22 industries, representing more than 14 million workers globally.
By 2030: 170 million new jobs created, 92 million displaced, a net gain of 78 million, and 22% of the global workforce affected by this churn either way.
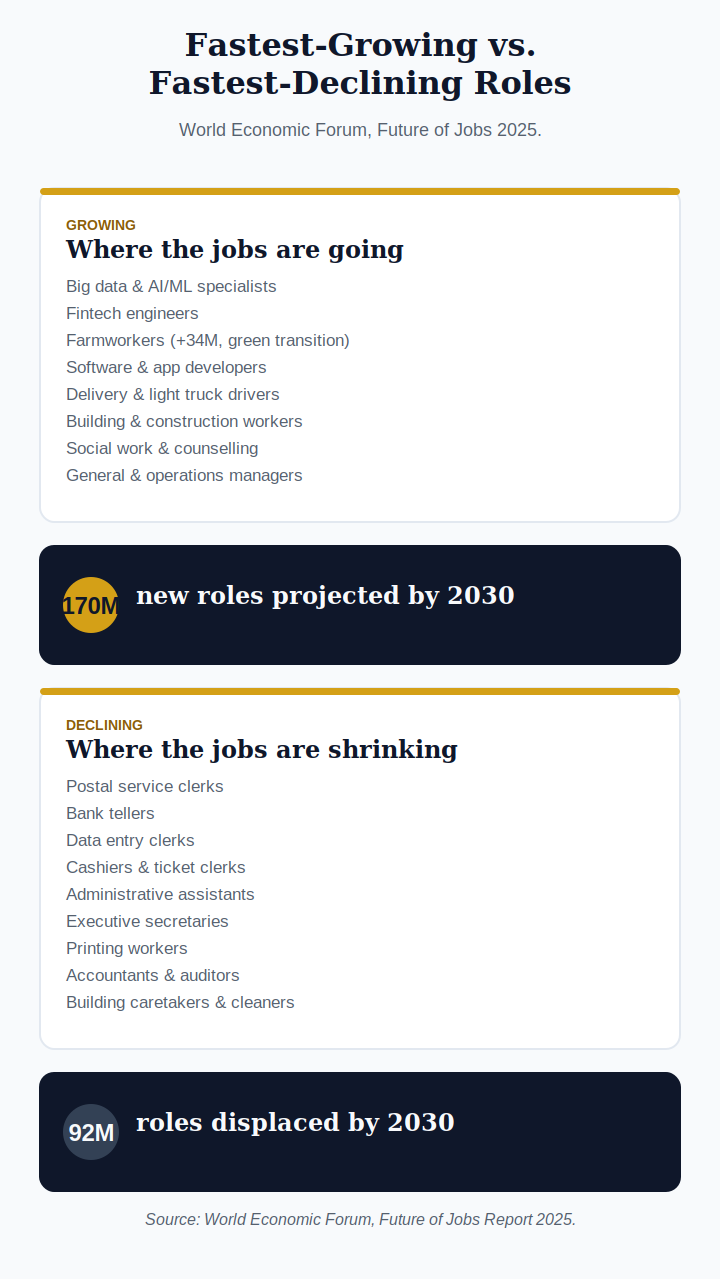
Growth concentrates in data, AI, and green-transition roles. Decline concentrates in routine clerical work.
The fastest-declining roles are heavily clerical: postal service clerks, bank tellers, data entry clerks, cashiers, administrative assistants, and executive secretaries.
The fastest-growing roles are concentrated in three areas: data and AI specialists, the green energy transition (farmworkers alone are projected to add 34 million roles), and human-contact services like construction, delivery, and social work.
The Overlooked Complication
A separate, longer-run U.S. study offers a caution worth carrying into the global picture. Research from MIT found that 60% of jobs in 2018 did not exist in 1940, the statistic usually cited as reassurance.
The same study found that where those new jobs land has shifted. From 1940 to 1980, new work concentrated in middle-paid production and clerical roles. From 1980 to 2018, it shifted toward high-paid professional work and, secondarily, low-paid service work, with automation eroding roughly twice as many jobs in the second period as the first.
Skills and Reskilling
The WEF report is specific about what changes, not just how many jobs.
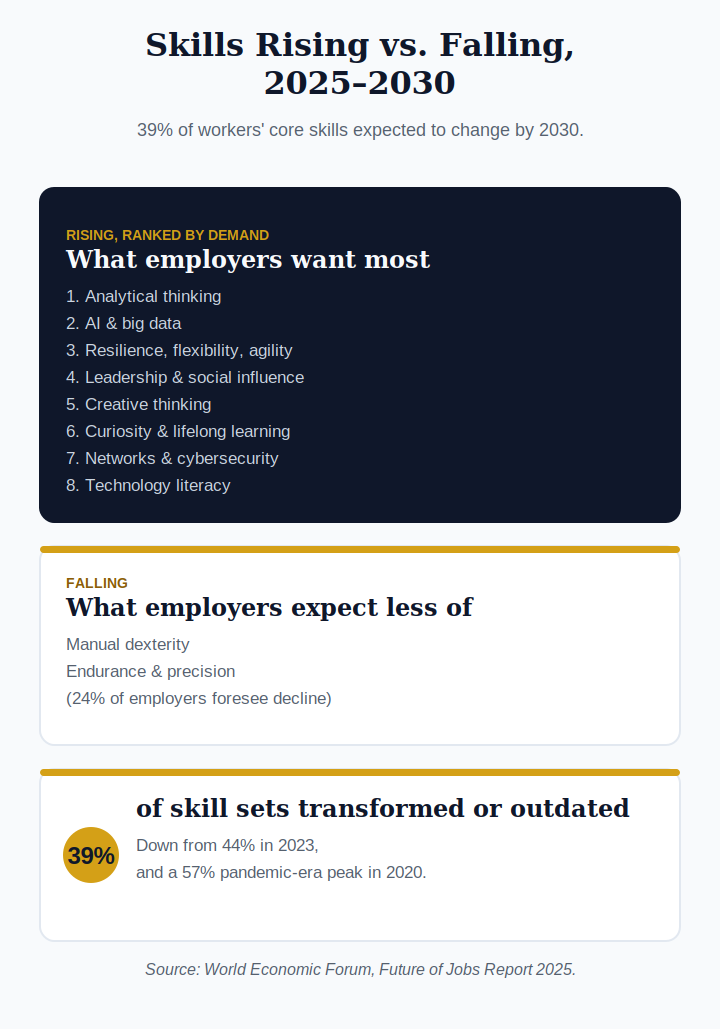
Analytical thinking, not a technical skill, tops the list.
Analytical thinking is the single most in-demand skill, cited by seven in ten employers, ahead of any specific technical skill. AI and big data literacy rank second, alongside resilience, flexibility, creative thinking, and curiosity, the human-side skills that complement rather than compete with AI tools.
Skill instability itself is easing slightly: 39% of core skills are expected to change by 2030, down from 44% in 2023 and a pandemic-era peak of 57% in 2020. The disruption is large but no longer accelerating.
Recommendations: The Companion Approach
Treat AI as a companion to a specific set of skills, not a replacement for a job title.
- Build analytical thinking deliberately. It outranks every technical skill on the WEF list, and it is the hardest one for AI to substitute for.
- Learn to direct AI tools, not just use them. Fluency with AI and big data is now a baseline expectation, not a specialization.
- Move toward roles with human contact, judgment, or physical presence. The fastest-growing categories, care work, construction, green-transition roles, and social work, share this trait.
- Treat reskilling as continuous, not a one-time event. Workers who moved early into new categories fared better than those who waited.
The occupations most exposed are the ones the data already names clearly: routine clerical and data-entry work. The occupations best positioned combine technical AI fluency with judgment, creativity, or in-person trust, the combination no current AI system replicates well.
Key takeaways
- Six waves in, technology has reliably created more jobs globally than it has destroyed.
- The AI wave is forecast to follow the same net-positive pattern: 170 million created against 92 million displaced by 2030.
- New work has not landed evenly since 1980, concentrating at the high and low ends of pay rather than the middle.
- Analytical thinking, AI fluency, and adaptability rank above any single technical skill for staying ahead of the shift.
References
1. The Changing Nature of Work. Human Progress.
2. 6 Jobs From the 1950s That Barely Exist Today. History Facts, citing U.S. Census and 2023 BLS data.
3. How Many People Are Employed in the U.S.? Trend Chart. ConsumerShield, citing BLS Employment Status data.
4. Dot-com bubble. Wikipedia.
5. A revealing look at the dot-com bubble of 2000. TED Ideas.
6. IT employment prospects: beyond the dotcom bubble. European Journal of Information Systems.
7. The Future of Jobs Report 2025. World Economic Forum.
8. Autor, D., Chin, C., Salomons, A., & Seegmiller, B. (2024). New Frontiers: The Origins and Content of New Work, 1940-2018. Quarterly Journal of Economics / NBER Working Paper 30389.